
Managing Soil and Nutrient Variability
_______________________________________________________________________________________________________________________________
Click here to view our Non-Discrimination Statement.
Soil sampling:
Precision Farming has allowed growers to become more efficient as well as better stewards of the land. Farmers must be able to keep up with technology to remain competitive. Managing variability has become a crucial part of many farming operations success. The methods for determining soil and nutrient variability continue to evolve.
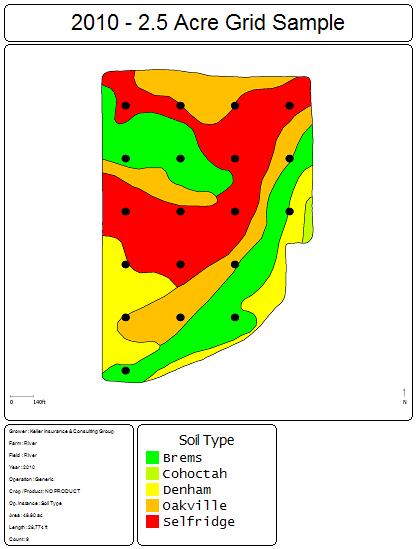
Soil sampling methods have changed vastly over the last decade. During the 1990’s, many growers were introduced to grid sampling. 2.5 Acre grid sampling provided growers with the information needed to manage variability better than they could have done before. However, sampling by grids does not accurately represent fields that have variable soils. Interpolation methods are used in mapping software to define soil test values between points. Therefore, the interpolated values predicted for un-sampled areas are only valid if there is a spatial dependence between the sample sites. (See figure 1) Please note that the sample points are not placed in a way that would allow for spatial dependence.
I combined the 2.5 Acre grid sample points and the soil type map to show the possibility for errors. Keep in mind samples pulled using this method only take into account the 2.5 Acre grid. As you can see, the 2.5 Acre grid method leaves a lot of room for errors. Therefore, newer methods have been adopted.
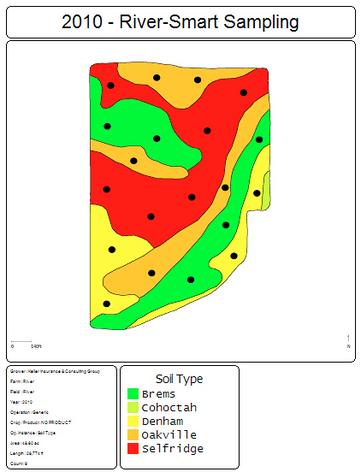
A few years ago, smart sampling became popular. Smart Sampling is a soil sampling method that does not rely on a fixed size grid, but instead tries to position sample points in a way that will capture the variability within the field. The number of samples taken will be the same as the 2.5 Acre grids, but with better placement.
Figure 1
Figure 2
Soil Survey maps are fairly accurate most of the time. However, many times small changes within a soil type were not discovered or mapped. Also, the changes from one soil type to another do not occur on a given line, rather there are transitional zones between different soils. Many soil survey maps have soil changes in error of 50 feet to 200 feet.
Variable rate prescriptions for nitrogen, planting, lime, and fertilizer are created using the soil information. If the soil surveys are incorrect, the variable rate prescriptions will not accurately address the variability within the field.
A few years ago, Veris Technologies introduced a machine that could measure Soil Electrical Conductivity (EC) on the go. EC is a measurement that provides an indication of soil layers, soil texture, and water holding capacity. EC readings are taken at two levels: 0”-12” (shallow reading) and 0”-36” (deep reading). The EC data will define the soil variability. Also, the EC data enables precise creation of management zones for predetermining soil sample points and the creation of all variable rate prescriptions. (Please refer to figures 3 and 4)
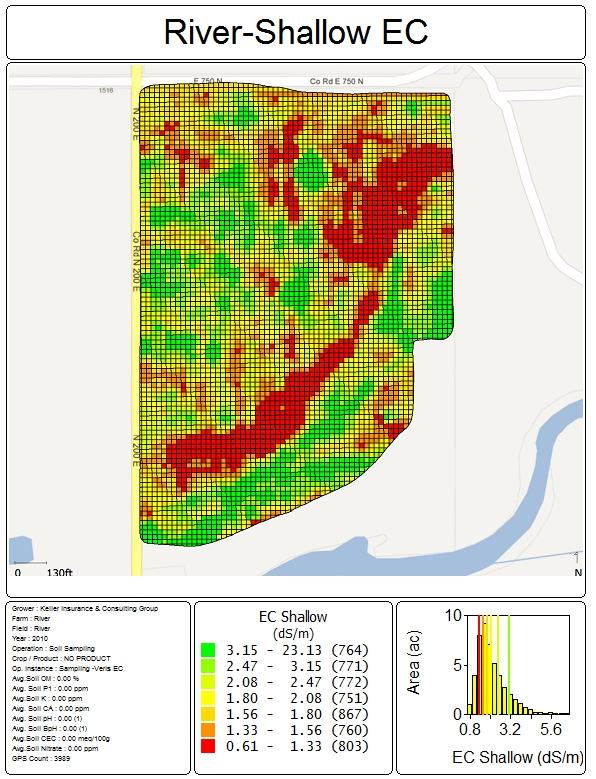
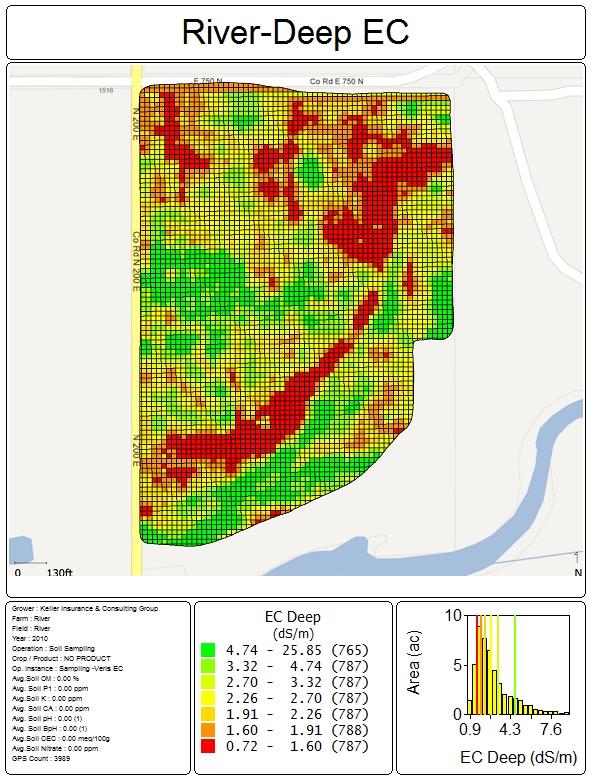
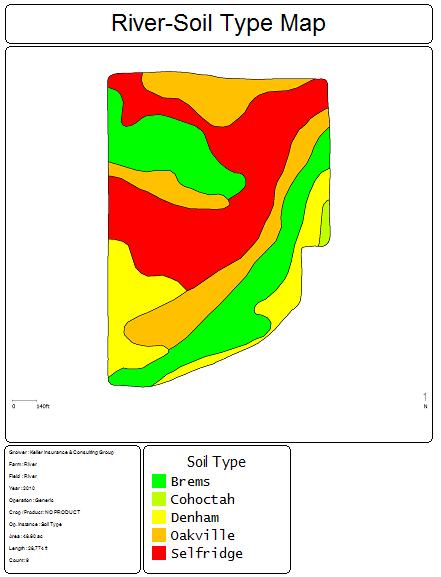
Figure 3
Figure 4
Figure 5
In comparison, figures 3 and 5 are not very similar. Figure 3 illustrates the soil variability much better than the soil survey map.
The management zones created from the EC data can be used to strategically pull soil samples. Strategic sampling is the most accurate method to determining nutrient variability. Also, the predicted values between sample points will have a high degree of spatial dependence.
KICG Agronomy Services
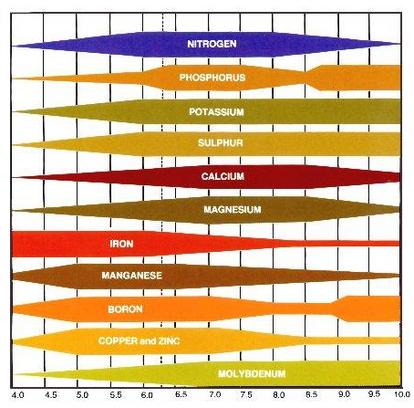
The soil pH within fields is highly variable. In the past, several methods of soil sampling have been used to try to account for the pH variability. However, the pH can vary as much within a 2.5 acre grid as it does throughout the whole field. Keep in mind pH is the first variable that must be addressed for proper nutrient management. Nutrient availability is highly dependent upon the soil pH. (Refer to figure 6) For most row crops the ideal pH is 6.3-7.0. If pH is too high or low, nutrient availability will be an issue or toxic levels of some nutrients could kill the plants.
Until recently, it was not economically feasible to take a high volume of soil samples because the cost would likely be greater than benefit. However, soil pH measurements can be taken on the go with the Mobile Sensor Platform (MSP) manufactured by Veris Technologies. The MSP is calibrated everyday using a pH solution of 4 and a pH solution of 7. Also, a few samples are pulled and sent to the lab just to verify the MSP-pH.
The number of pH samples taken by the MSP depends on the speed and transect width. Usually about 10 samples per acre are taken. That will allow growers to have 25 times the information about pH levels than previous methods.
pH and Lime:
Figure 7 is the pH from the lab samples and figure 8 is the pH readings from the Veris MSP. As you can see, there is variability that one sample per 2.5 acres is not able to indicate.
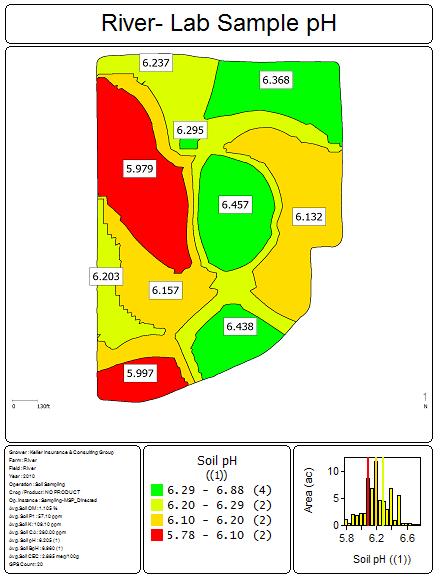
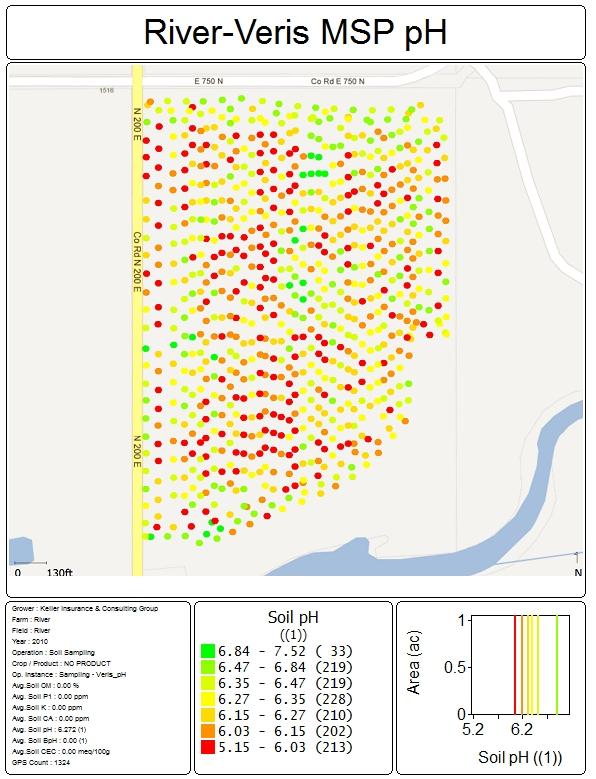
Figure 7
Figure 8
Defining the pH variability with the Veris MSP will enable growers to apply lime much more accurately than ever before. As stated earlier, the correct pH will enable optimum uptake of all other nutrients, therefore, higher yields.
(Figure 9) is the lime recommendation based off of the 20 samples sent to the lab. (Figure 10) is the lime recommendation derived from the Veris MSP. (Figure 10) is a more defined and accurate prescription. The extra information will not always lead to lower amounts of lime needing to be applied, but it will help balance the pH so you can get higher yields out of your soils. Also, the information will enable you to make better management decisions on other inputs as well.
Please notice the variable rate seeding prescription. This prescription was created using the Veris Electrical Conductivity.
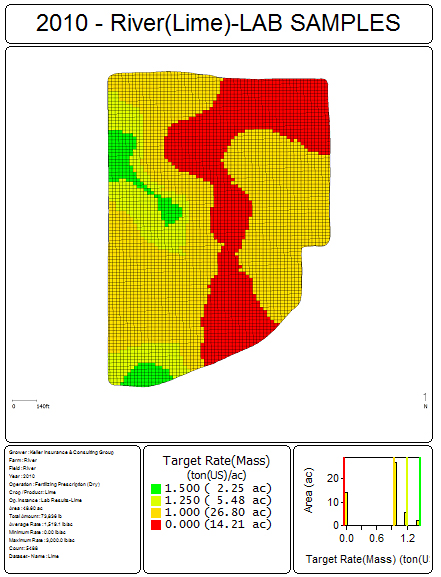
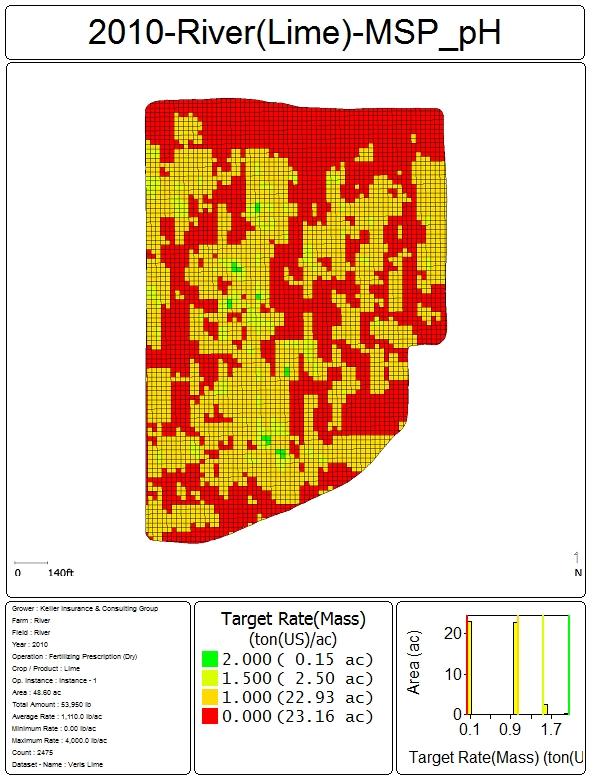
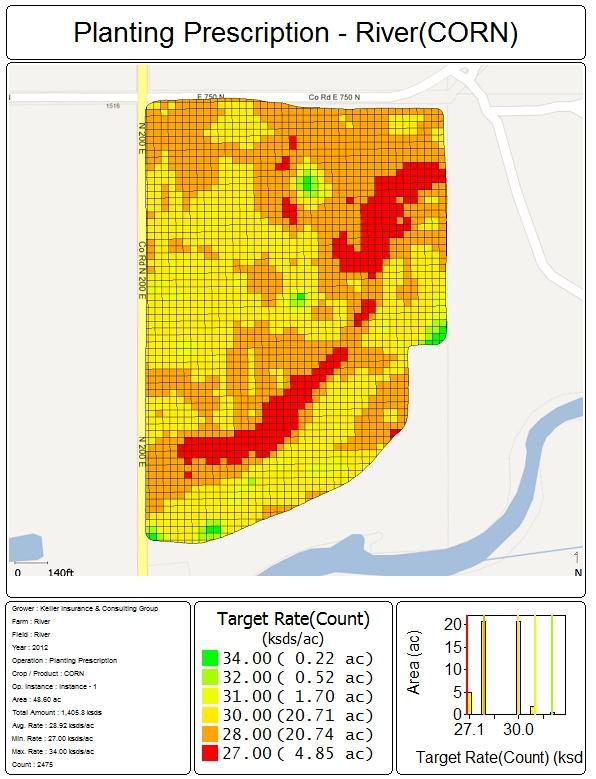
Figure 9
Figure 10
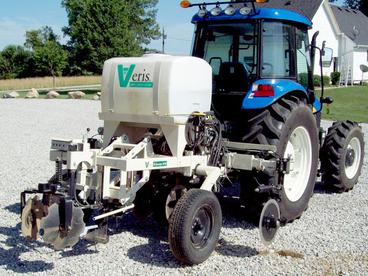
Veris MSP 3150
Figure 6